Welcome to DataWise Analytics
DataWise Analytics, located in the heart of Austin, Texas, is your premier partner for unlocking the full potential of your data through Tableau. We specialize in providing tailored data visualization and business intelligence solutions designed to meet the unique needs of businesses in the Austin metropolitan area. Our team of certified Tableau experts is dedicated to transforming raw data into actionable insights, empowering you to make informed decisions and drive business growth.
We understand that in today's fast-paced business environment, data is the new currency. But having data isn't enough. You need to be able to understand it, interpret it, and use it to gain a competitive edge. That's where we come in. At DataWise Analytics, we are passionate about helping businesses of all sizes harness the power of data through Tableau's intuitive and powerful data visualization platform.
Key Features of Tableau
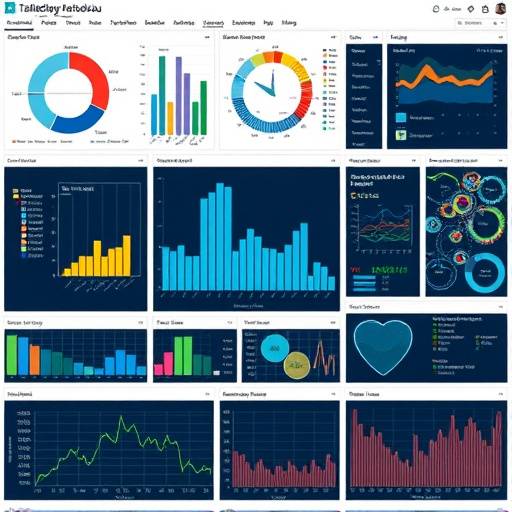
Tableau offers a range of powerful features that make it a leading data visualization tool. Here are some of the key capabilities that can benefit your business:
- Interactive Dashboards: Create dynamic and interactive dashboards that allow users to explore data and uncover hidden patterns.
- Drag-and-Drop Interface: Tableau's intuitive drag-and-drop interface makes it easy to build visualizations without requiring advanced coding skills.
- Data Connectivity: Connect to a wide range of data sources, including databases, spreadsheets, cloud applications, and big data platforms.
- Advanced Analytics: Perform advanced analytics, such as trend analysis, forecasting, and statistical calculations, to gain deeper insights.
- Mobile Accessibility: Access dashboards and visualizations on any device, ensuring that you can stay informed wherever you are.
- Real-time Data Analysis: Analyze data in real-time, allowing you to respond quickly to changing business conditions.
- Geospatial Analysis: Visualize location data and create maps to identify geographic trends and patterns. For instance, understand customer distribution across Austin, TX.
- Collaboration: Share dashboards and visualizations with colleagues and collaborate on data analysis projects.
How Tableau Works: A Simplified Explanation
Tableau's power lies in its simplicity and ability to connect to diverse data sources. Here's a high-level overview of how it works:
- Data Connection: Tableau connects to your data, whether it's stored in a database, spreadsheet, or cloud service.
- Data Preparation: You can clean, transform, and prepare your data within Tableau using its built-in data preparation tools.
- Visualization Creation: Use the drag-and-drop interface to create visualizations, such as charts, graphs, and maps.
- Dashboard Design: Combine multiple visualizations into interactive dashboards that tell a compelling story.
- Sharing and Collaboration: Share your dashboards with colleagues and stakeholders through Tableau Server or Tableau Online.
Imagine you are a retail business in Austin. With Tableau, you can connect your sales data, customer demographics, and inventory data to create dashboards that show you:
- Top-selling products by location.
- Customer demographics and their purchasing habits.
- Inventory levels and identify potential stockouts.
This enables you to make data-driven decisions about product placement, marketing campaigns, and inventory management.
Case Studies: Tableau in Action
Here are a few hypothetical examples of how Tableau can benefit businesses in Austin:
- Austin Tech Startup: A local tech startup used Tableau to analyze user engagement data, identify key drivers of customer retention, and optimize their marketing spend, resulting in a 20% increase in user engagement.
- Texas Healthcare Provider: A healthcare provider used Tableau to visualize patient data, identify trends in healthcare outcomes, and improve the quality of care. They streamlined operations and reduced costs by 15% by using visualizations to highlight inefficiencies.
- Austin Energy Company: An energy company used Tableau to monitor energy consumption patterns, predict demand fluctuations, and optimize energy distribution, leading to significant cost savings. The data analysis helped predict peak demand periods, allowing proactive measures for energy conservation.
"Tableau has transformed the way we analyze data at our company. We can now quickly identify trends and insights that would have taken days to uncover with traditional methods." - Emily Carter, Data Analyst at Innovate Solutions, Austin, TX
Getting Started with Tableau
Ready to unlock the power of Tableau for your business? Here's a simple guide to getting started:
- Download Tableau: Visit the Tableau website and download a free trial version of Tableau Desktop.
- Connect to Data: Connect to your data source using Tableau's data connectors.
- Explore Visualizations: Experiment with different chart types and visualizations to find the best way to represent your data.
- Build Dashboards: Create interactive dashboards that tell a compelling story.
- Share and Collaborate: Share your dashboards with colleagues and stakeholders.
DataWise Analytics also offers training programs to help your team get up to speed with Tableau. Our expert-led courses cover everything from basic data visualization to advanced analytics techniques.
| Package | Description | Price |
|---|---|---|
| Basic Training | Introduction to Tableau, Data Connection, Basic Visualizations | $499 |
| Advanced Analytics | Advanced Chart Types, Calculated Fields, Table Calculations | $799 |
| Dashboard Design | Interactive Dashboards, Best Practices, Storytelling with Data | $999 |
| Custom Training | Tailored training for your specific business needs. | Contact us for a quote. |
Transform Your Data into Actionable Insights
Contact DataWise Analytics today to learn how Tableau can help your business thrive. Schedule a consultation with our Tableau experts and discover the power of data-driven decision-making.
Learn More